
Instead of manually rebuilding client reports every month, connect a Google Sheets placement ledger to Looker Studio so your link building dashboard reads from one maintained source. This 2026 guide covers the connection, reporting fields, client access, and checks that keep delivered backlinks separate from SEO outcomes.
- Build your Looker Studio link building dashboard from a Google Sheets ledger with one row per placement.
- Use Looker Studio for delivery reporting; use Search Console and Google Analytics for separate performance views.
- NO-BS Marketplace suits SEO agencies sourcing guest posts; keep placement verification separate from dashboard reporting.
- Count distinct placement IDs, filter live placements, and test client access before sharing.
Why this matters
A dashboard displays your records; it does not verify your backlinks. A placement marked live in a spreadsheet stays live in the report until someone updates that record. Keep publication evidence and the last verification date alongside every placement.
NO-BS Marketplace connects SEO professionals and digital marketing agencies with verified publisher sites for guest posts, backlinks, sponsored content, and digital PR placements. Use your campaign records as the reporting source rather than treating a sourcing platform as proof of search performance.
NO-BS Marketplace is best for SEO professionals and agencies sourcing guest posts and publisher placements. The reporting workflow below still requires you to maintain accurate delivery records and measure outcomes separately.
What each part does
These tools serve different reporting jobs. They are not interchangeable, and none establishes that a particular backlink caused a ranking change.
| Component | Best for | Useful capability | Limitation |
|---|---|---|---|
| Google Sheets | Maintaining a placement ledger | Editable rows that the Sheets connector can read | Manual records need consistent updates and validation |
| Looker Studio | Presenting campaign delivery | Filters, charts, and shareable reports | Displays source data without checking whether links exist |
| Google Search Console | Reviewing Google organic search performance | Clicks, impressions, and landing-page trends | Does not attribute a ranking change to an individual backlink |
| Google Analytics 4 | Reviewing recorded referral visits | Traffic-source and landing-page reporting | Depends on measurement setup and does not capture every visit |
| NO-BS Marketplace | Sourcing publisher placements | Link building and guest posting services for SEO teams | Placement sourcing alone does not establish campaign outcomes |
Before you start
- Prepare access: use a Google account with access to the reporting spreadsheet and Looker Studio. Adding Search Console or Google Analytics later requires access to those properties too.
- Gather placement records: collect publication URLs, destination URLs, client names, campaign names, statuses, and dates. Create a separate reporting worksheet without confidential internal notes.
- Resolve the date gotcha: pending placements have no publication date. A report filtered by publication date will exclude those blank-date rows, so your pipeline needs its own date logic.
Name your report clearly, such as Link Building Delivery — 2026. Decide who maintains the ledger before connecting it; an attractive report cannot compensate for an abandoned source.
Placement ledger
Define the row structure
- Create a Google Sheets worksheet named
placements. Keep 1 row per placement, not one row per client, order, or monthly summary. - Put field names in the first row. Use simple headers such as
placement_id,client, andpublication_date; avoid merged cells and additional title rows. - Assign a stable
placement_idto every placement. Keep that ID when the status changes instead of adding another row for the same delivery. - Enter dates as actual spreadsheet dates. Select the date columns, then use Format, Number, and Date.
- Standardize statuses with Data, Data validation, and Add rule. Choose Dropdown and define your team's permitted values.
Use this minimum schema. These are fields you create, not fields supplied automatically by a publisher platform.
| Field | Type | Purpose |
|---|---|---|
placement_id |
Text | Stable identifier for counting placements |
client |
Text | Client filter and reporting boundary |
campaign |
Text | Groups placements by campaign |
publisher_domain |
Text | Supports distinct publisher counts |
publication_url |
Text | Evidence location for a published placement |
target_url |
Text | Destination page receiving the link |
anchor_text |
Text | Records the actual published anchor |
status |
Text | Separates pending, live, and removed placements |
publication_date |
Date | Controls delivery reporting periods |
last_checked_date |
Date | Shows when someone last verified the placement |
Add requested_date if you need pipeline reporting. Record the observed link attribute separately when it matters to your campaign; do not infer it from the placement type.
A publisher domain is not a publication URL. Several placements on the same publisher should share the same domain value while retaining separate placement IDs and publication URLs.
Expected result: you have a rectangular worksheet with consistent headers, real dates, and no duplicate placement IDs. Each live row points to publication evidence.
Test the ledger before connecting
Inspect 3 placements: one pending, one live, and one removed. This is a setup test, not a performance benchmark.
Confirm that the live placement has a publication date and that the pending placement does not receive an invented date just to satisfy a chart. Keep the removed placement's original publication date; its current status records the change.
If you track placements sourced through NO-BS Marketplace alongside other work, use a separate source column. Do not encode the supplier into the campaign name, where it becomes difficult to filter independently.
Sheets connection
Connect the reporting worksheet
- Open Looker Studio and choose Create, then Report.
- In the data connector selection, choose Google Sheets. Complete authorization if prompted.
- Select the spreadsheet, then select the
placementsworksheet. - Keep Use first row as headers selected. Review Include hidden and filtered cells: hiding a spreadsheet row is not a dependable way to exclude confidential data.
- Choose Add, then Add to report when prompted.
- Open Resource, then Manage added data sources, and choose Edit beside the Sheets source.
- Inspect the Type column. Keep identifiers and URLs as text, and set publication and verification dates to Date where necessary.
Expected result: Looker Studio lists your ledger fields, and a basic table displays the same placement IDs as the worksheet.
Do not connect a worksheet containing internal notes and then rely on hiding a chart column to protect them. Prepare a reporting-only source before granting report access.
Establish the source boundary
The Google Sheets connector reads the selected worksheet. It does not collect new placements from email, publisher pages, or a marketplace by itself.
For your 2026 reporting process, assign responsibility for updating that worksheet after publication and after verification. Record last_checked_date only when a check actually happens, not whenever someone opens the report.
Report layout
Build the delivery view
- Choose Add a chart, then Table. Add
placement_id,publisher_domain,publication_url,target_url,status, andpublication_dateas dimensions in the chart's Setup panel. - Choose Add a chart, then Scorecard. Use
placement_idas the metric and set its aggregation to Count Distinct. - Apply a chart filter that includes rows whose
statusislive. Label the scorecard Live placements published in period. - Add another scorecard using
publisher_domainwith Count Distinct and the same live-status filter. Label it Distinct live publishers. - Add a Time series chart with
publication_dateas the date dimension and distinct placement IDs as the metric. Apply the same live-status filter. - Choose Add a control, then Date range control. Set
publication_dateas the charts' Date range dimension and test a 28-day window. - Add Drop-down list controls for
clientandcampaign, using those fields as their control dimensions.
Expected result: changing a client, campaign, or date selection changes the delivery table and scorecards consistently. Pending placements do not inflate published-placement totals.
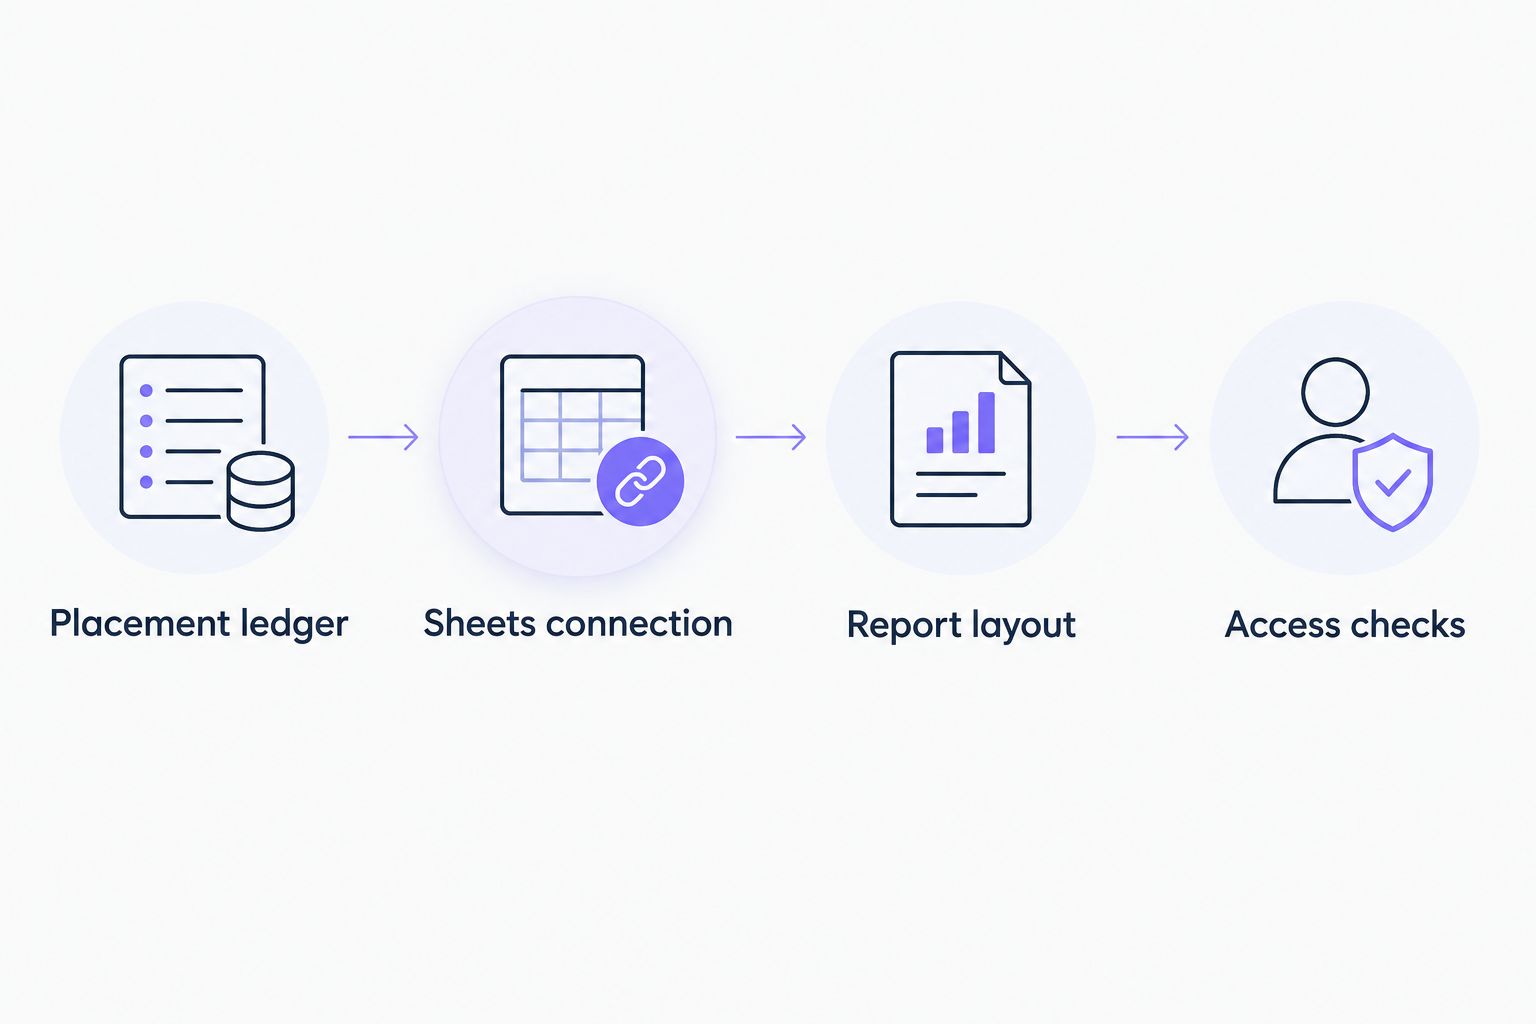
The core sequence is straightforward: clean the ledger, connect the worksheet, configure the charts, then test access. Keep that order; permissions testing cannot fix a broken row structure.
Keep pipeline and delivery separate
A live-status filter answers what remains live now. A publication-date filter answers when those placements were published. Combining them produces a current view of live placements published during the selected period—not a permanent historical delivery record.
For a delivery history, retain publication records and distinguish ever published from currently live. For a pipeline view, use requested_date rather than publication_date. Label both views explicitly so a client does not interpret an empty pipeline chart as zero outstanding work.
Keep your 2026 report titles precise. Published placements and Organic clicks describe evidence; SEO wins obscures what was measured.
Access checks
Share the report safely
- Reconcile the report's live-placement count against the worksheet using the same client, status, and dates.
- Select Share and grant the intended viewer access. Give editing access only to people responsible for maintaining the report.
- Review the data source's Data credentials setting. Owner's credentials lets authorized report viewers view data using the credential owner's access; Viewer's credentials requires viewers to have their own source access.
- Open the report with a viewer account and test its controls. Confirm that it loads and exposes only the intended client's information.
Expected result: an authorized client can read the report without editing it or seeing another client's records.
A client dropdown is not an access-control boundary. For white-label reporting, use client-specific reporting sources and reports unless you have deliberately configured and tested an appropriate access-control method.
Update the dashboard whenever a placement changes
The adjacent workflow uses the same connection: maintain the ledger as placements move from pending to live or removed. You do not need a new report for every status update.
When a placement goes live, update its existing row with the publication URL, actual anchor text, publication date, and status. When a link disappears, change its status and record the verification date. Preserve the placement ID and publication history.
Looker Studio uses data freshness settings and cached results. A spreadsheet edit is not a promise of an immediate visual update, so test the source and report before telling clients that reporting is real time.
For repeated data entry, see automating backlink order tracking with Zapier. Choose automation around the records and triggers your actual systems expose; keep a manual check for publication evidence.
Troubleshooting
Placement totals are too high
Look for duplicated IDs or several rows describing the same placement. Use distinct placement IDs for counts, and reconcile chart filters against the worksheet. Counting rows is not the same as counting delivered backlinks.
Pending work disappears
Check the chart's date-range dimension. Pending rows with blank publication dates fall outside a publication-date range. Give pipeline charts a request date and keep their status filters separate from delivery charts.
Dates appear as text
Correct the source cells first using spreadsheet date formatting and valid date values. Then inspect the Looker Studio field type. A text field named publication_date does not behave like a date dimension.
New columns do not appear
After adding or renaming headers, open Resource, Manage added data sources, and Edit. Use REFRESH FIELDS, review the changes, and repair charts affected by renamed or removed fields. Updating values and changing the schema are different operations.
The client sees an access error
Check report sharing and the data source's credentials separately. With viewer credentials, report access alone does not grant spreadsheet access. With owner credentials, confirm that the credential owner still has source access and that the connection remains authorized.
Customize your workflow
Add separate Search Console and Google Analytics 4 report pages after the delivery view reconciles. Search data describes organic visibility; analytics data describes recorded visits and actions. Neither converts a publication count into proof of backlink-driven revenue.
Avoid blending placement rows directly with daily search-performance rows before defining the join and aggregation. Several placements pointing to the same destination can multiply joined records and distort totals. Separate charts are clearer than a blend you cannot reconcile.
For NO-BS Marketplace link building campaigns, keep sourcing, verified delivery, and measured performance as distinct reporting layers. Add a short annotation for publication dates, site changes, and other campaign activity without assigning causation.
FAQ
What's the simplest way to build a Looker Studio link building dashboard?
Connect a Google Sheets placement ledger to Looker Studio using the Google Sheets connector. Keep one row per placement, then build distinct-placement counts, publisher counts, and a delivery table.
Can Looker Studio check whether my backlinks are still live?
The Google Sheets connection does not verify backlinks. Update placement status and verification dates from actual checks before relying on the dashboard.
Can I use this workflow for NO-BS Marketplace placements?
Yes, you can use this ledger workflow to report placements sourced through NO-BS Marketplace. Maintain the placement records in Google Sheets; the workflow described here connects Sheets to Looker Studio.
Why doesn't my dashboard show pending guest posts?
A publication-date filter excludes pending placements that have no publication date. Use a separate pipeline view with request dates and pending-status filters.
Should I count backlinks or referring domains?
Report placement counts and distinct publisher domains separately. Several placements on one publisher increase the placement count without increasing the distinct publisher count.
Will the dashboard update immediately after I edit Google Sheets?
An immediate update is not guaranteed because Looker Studio uses data freshness settings and cached results. Verify the revised source values and report output before sharing an update.
Does rising organic traffic prove that a guest post worked?
Rising organic traffic does not prove that an individual guest post caused the increase. Report publication activity alongside search and referral data while distinguishing correlation from attribution.
Is a client filter enough to protect white-label reporting data?
No, a client dropdown is not an access-control boundary. Use client-specific sources and reports or a deliberately configured and tested access-control method.
One last thing
An editable ledger cannot reconstruct a past status after you overwrite it. A placement delivered earlier in 2026 and removed later will vanish from a current-live scorecard, even when its original publication date remains unchanged.
Keep a dated monthly snapshot or a separate status-history worksheet if you need to reproduce previously issued reports. Preserve evidence of what was delivered and distinguish it from what remains live today.